Help
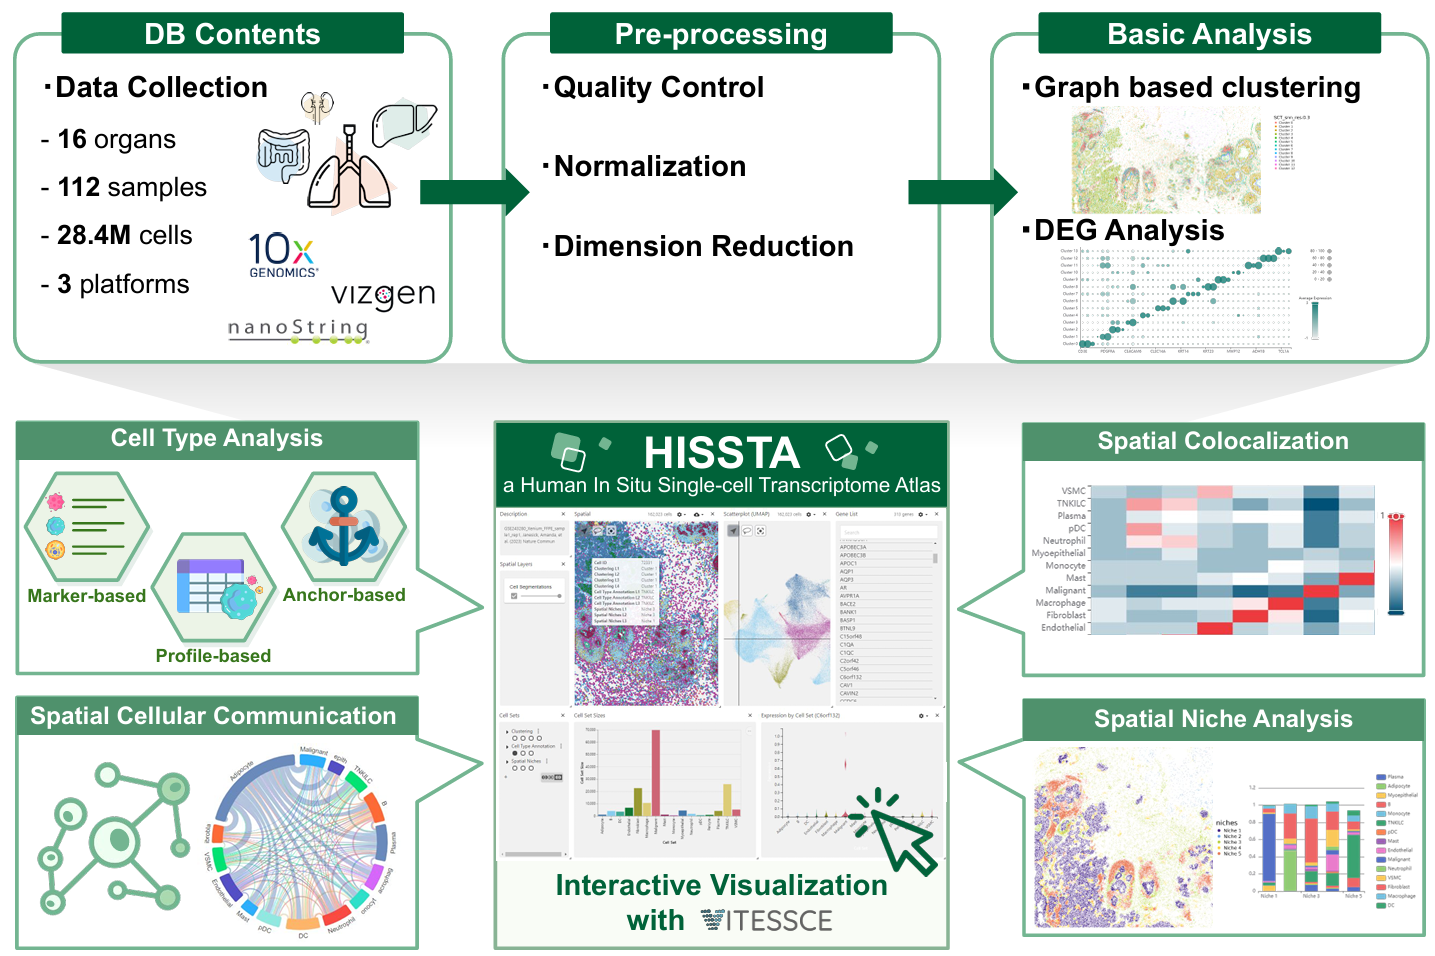
The HISSTA database includes spatial single-cell transcriptome data from various human tissues, utilizing primary techniques such as MERFISH (Vizgen), CosMx (Nanostring), and Xenium (10x) to achieve genuine single-cell resolution in situ. We support the exploration of datasets, preliminary analysis results, and interactive visualization with Vitessce.
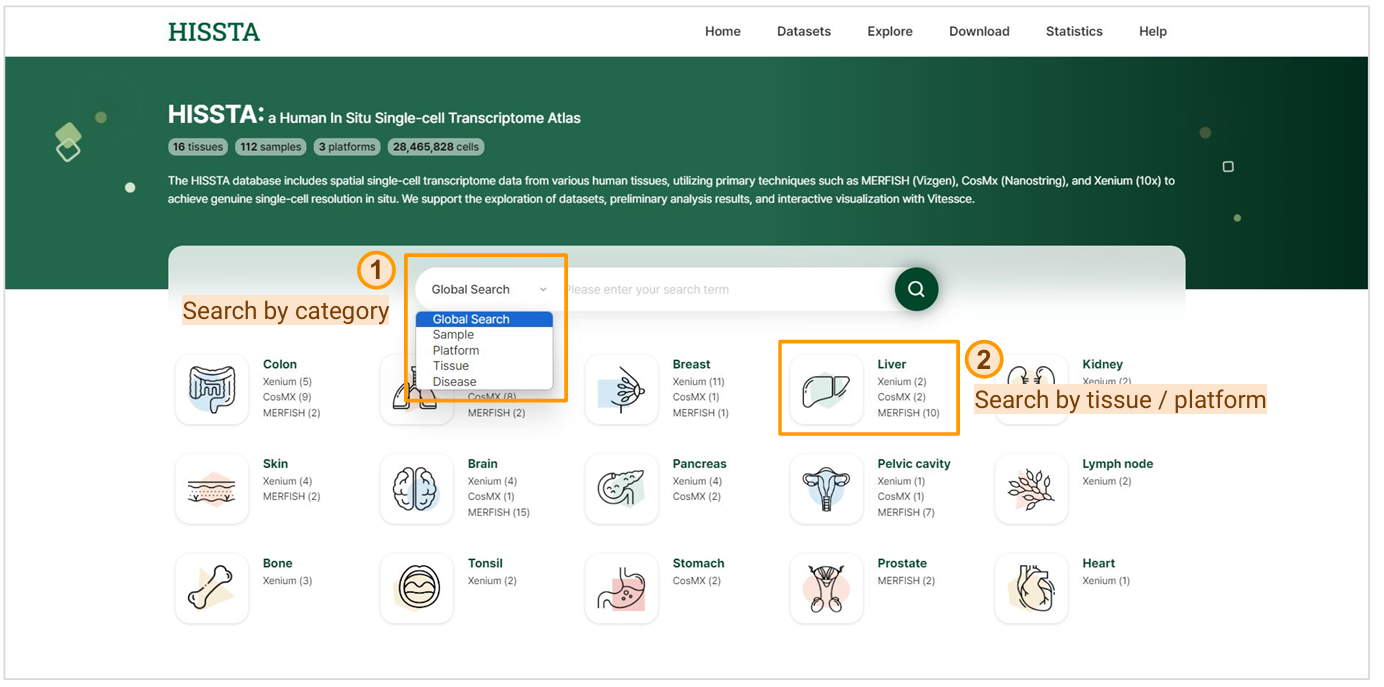
This page offers a variety of search functionalities. You can perform a global search using the search bar or refine your search by setting categories such as Dataset, Sample, Platform, Tissue, or Disease. Clicking on a tissue name filters and displays samples related to that specific tissue, while clicking on a platform name allows you to search for samples associated with both the selected tissue and platform.
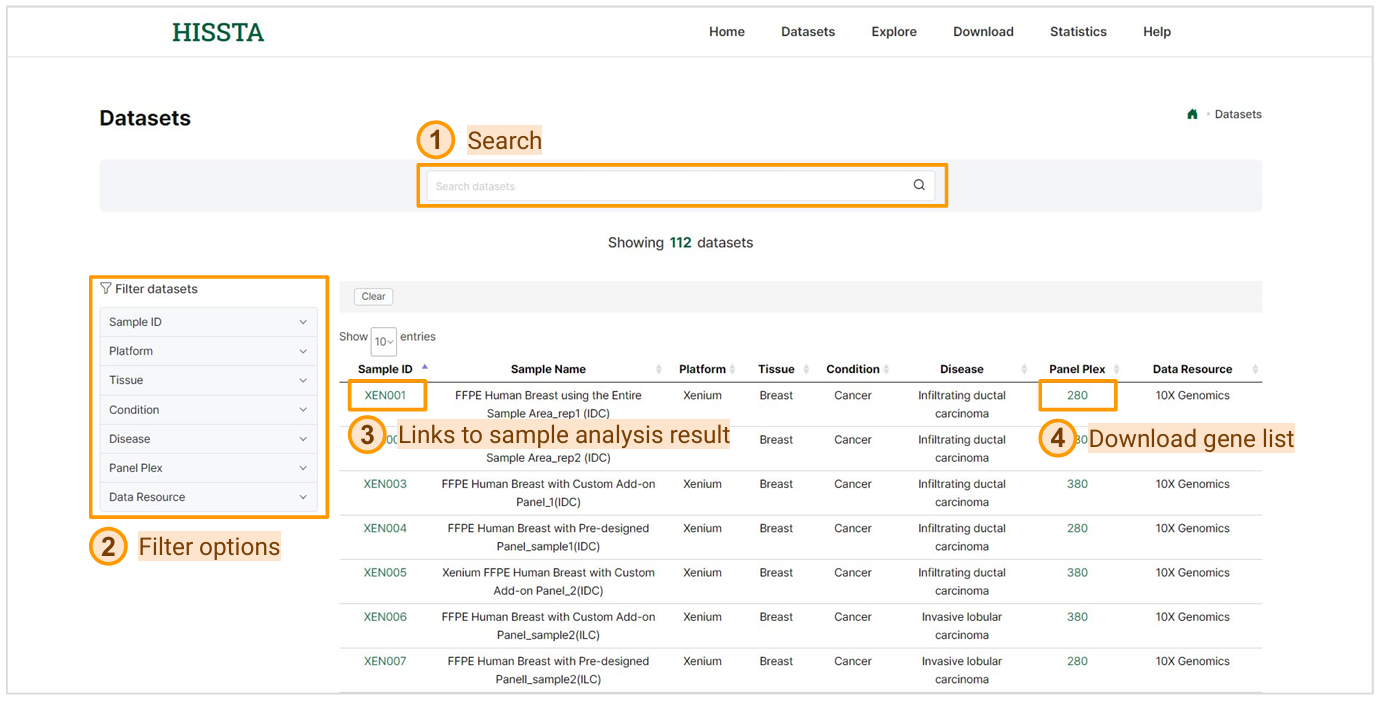
This page includes various spatial samples and provides global search and various filtering options to help you find the sample you need. By clicking on a Sample ID, you can view detailed descriptions and various analysis results for that specific sample. Clicking on Panel Plex allows you to download the gene list of the panel used in the sample as a CSV file.
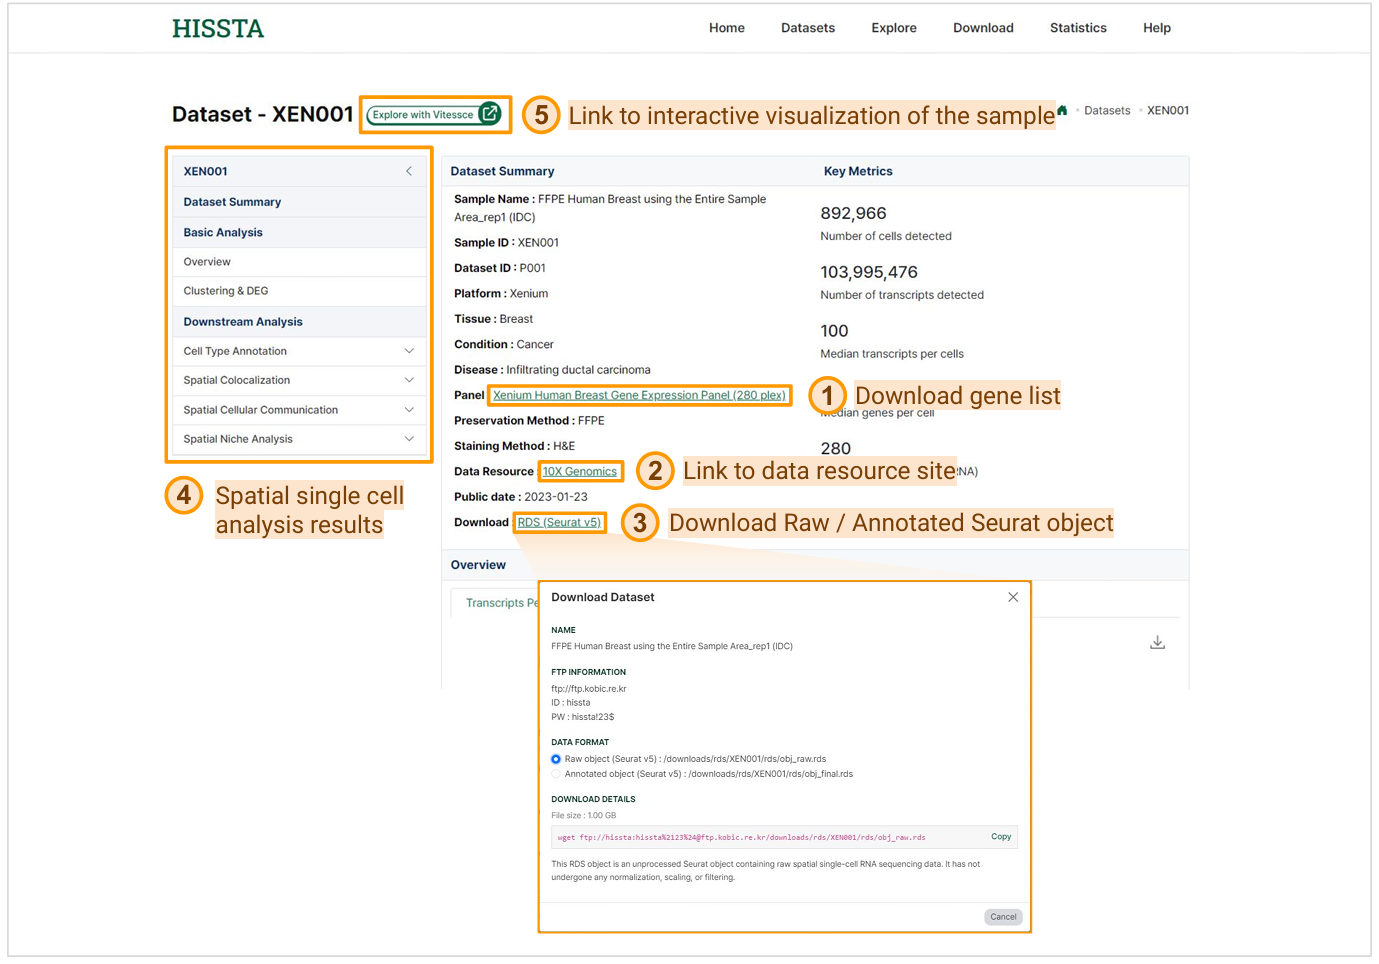
The sample detail page provides a comprehensive dataset summary with various information about the sample. By clicking on the Panel name, you can download the gene list used in the sample as a CSV file. If you click on the Data Resource link, you will be redirected to the original site that provides the data. In the download section, clicking on RDS (Seurat v5) will display a wget command that you can use to download either the raw or annotated data. Additionally, the page offers results from basic analyses such as clustering and dimension reduction, as well as downstream analyses including cell type annotation, spatial colocalization, spatial cellular communication, and spatial niche analysis. By clicking Explore with Vitessce, you can access an interactive visualization of the sample.
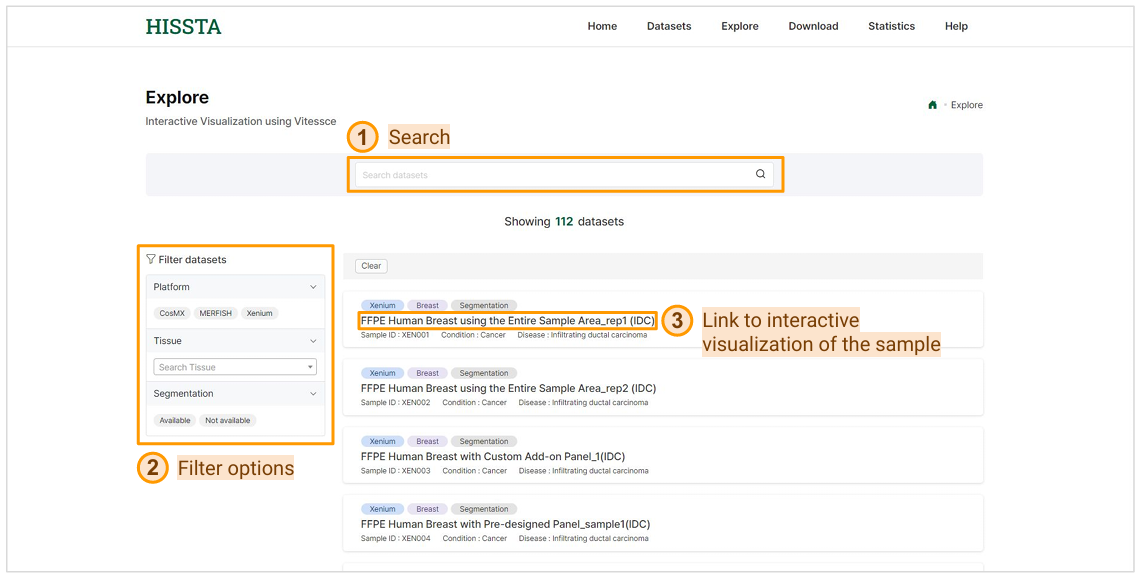
On this Explore page, you can search for datasets using the search bar at the top to quickly find specific samples. You can also use the filter options on the left to narrow down the datasets based on platform, tissue, or segmentation availability. Once you find the dataset you're interested in, click on the sample name to access the interactive visualization of the sample, allowing you to explore the data in detail.
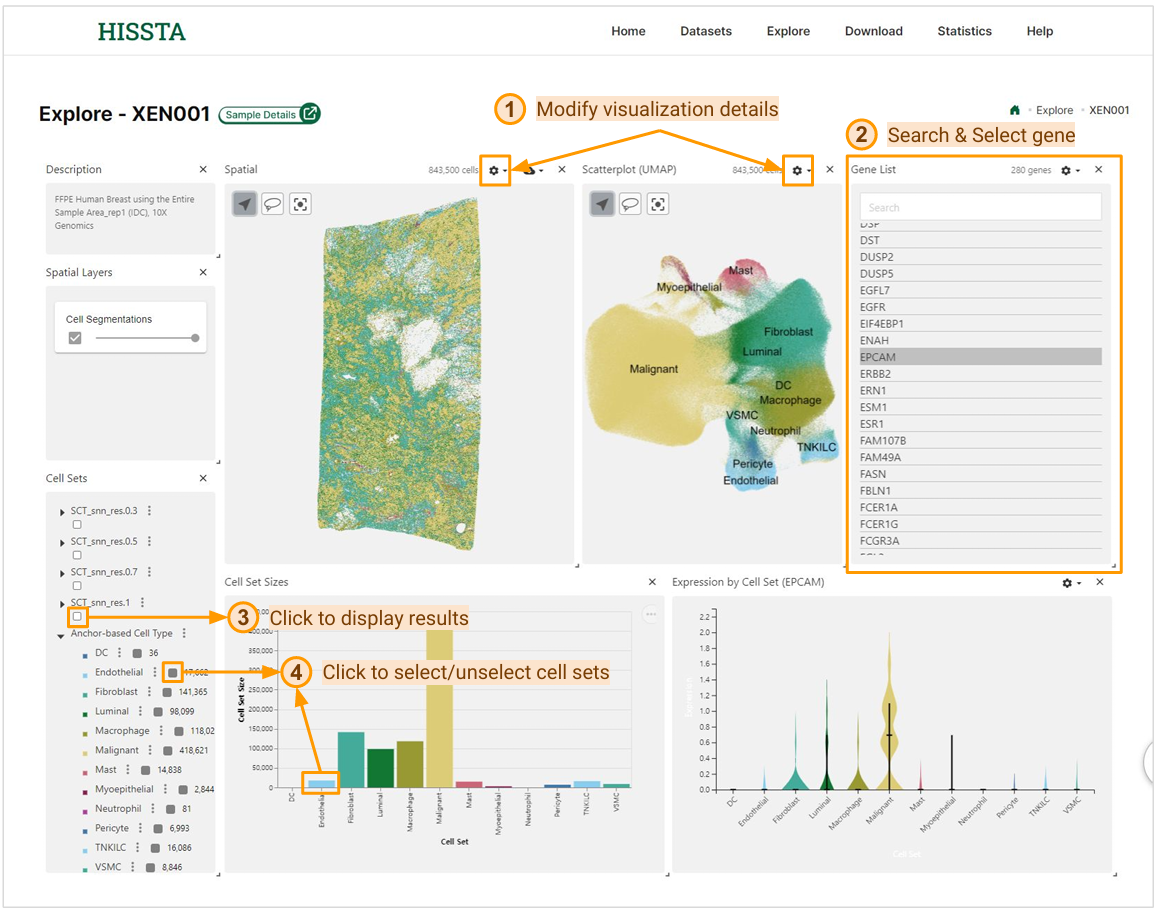
The interactive mode page for each sample offers various features and visualizations. You can view the spatial distribution of each cell using spatial coordinates and cell segmentation information, and see the results of dimensionality reduction on a UMAP plot. By clicking the settings button at the top of both areas, you can adjust the visualization details.
By selecting a gene name from the Gene List panel, you can view its expression levels across the Spatial panel, Scatter plot (UMAP), and Expression by Cell Set. The Cell Sets panel allows you to display the results of clustering, cell type annotation, and spatial niche analysis for the sample. You can select or deselect the cell sets you want by clicking the checkboxes in the panel, or by clicking on the bars in the bar chart.
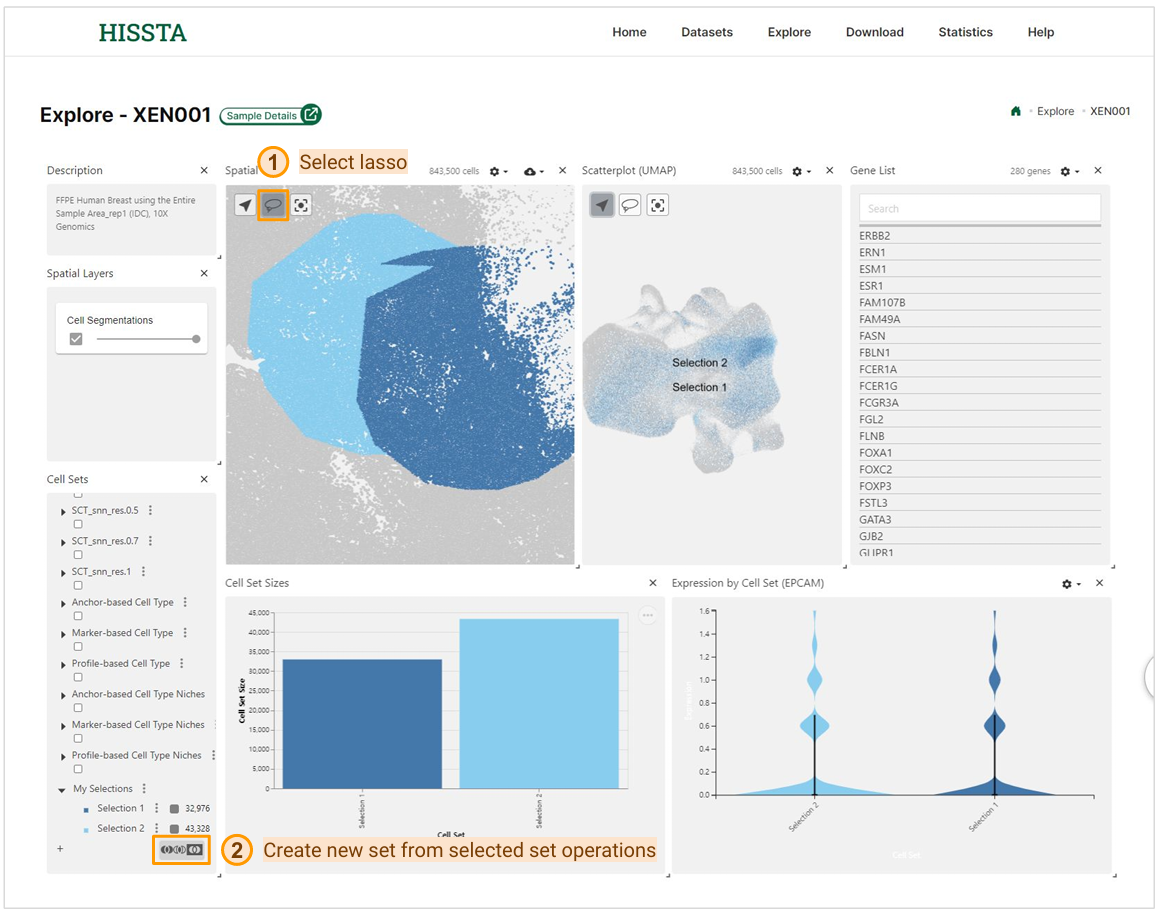
In addition to these features, this interactive exploration page allows you to select cells using the lasso tool to highlight specific regions of interest on the plots. After making selections, you can use the set operations to create new cell sets. This feature enables you to generate a new set from the union, intersection, or complement of the checked sets.
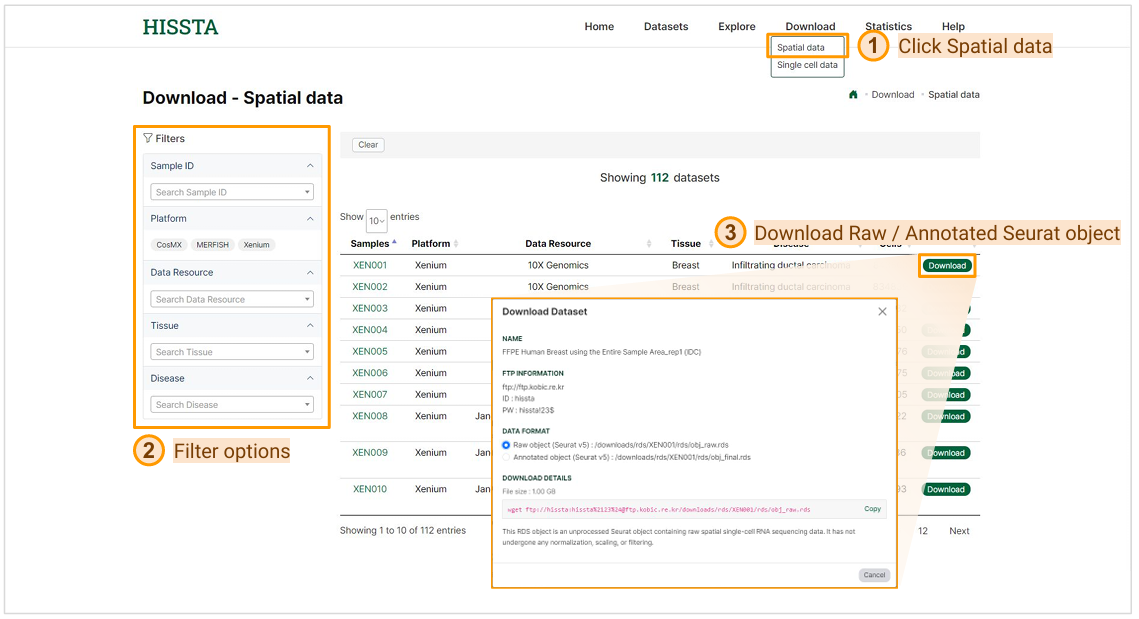
Spatial data download page can be accessed by clicking on the Spatial data option under the Download tab in the top menu. Using the filtering options, you can navigate the dataset list to find your desired dataset. To download a dataset, click the Download button next to it. In the download window that appears, select your preferred "DATA FORMAT". All provided files are handled in Seurat v5. The Raw object RDS file contains the unprocessed data, whereas the Annotated object RDS file includes results from basic analyses like QC, normalization, and dimensionality reduction, along with downstream analyses such as cell type annotation, cell-cell communication, and niche analysis.
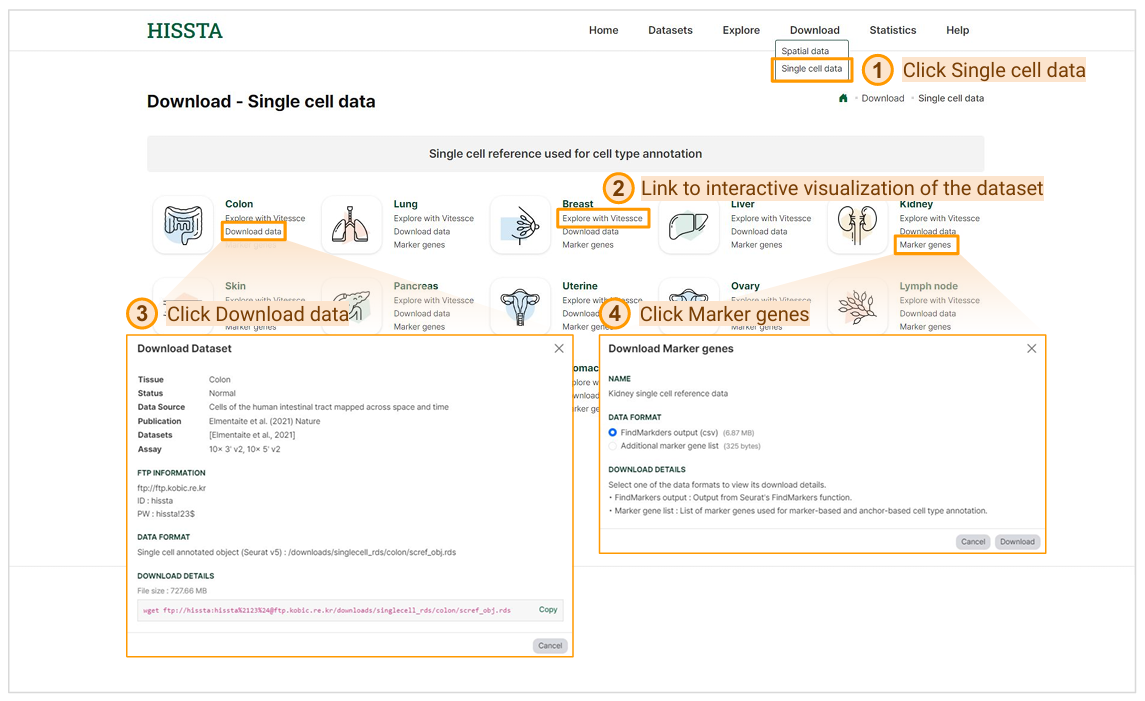
Single cell data download page can be accessed by clicking on Single cell data under the Download tab in the top menu. To explore a dataset interactively, click the Explore with Vitessce button for that dataset. To download a dataset, click Download data under the specific tissue name. The provided files are processed in Seurat v5 and include information on normalization, dimensionality reduction, and curated cell types. To download the marker gene list for a dataset, click Marker genes under the specific tissue. The "FindMarkers output (csv)" file contains results from Seurat's FindAllMarkers() function, based on the cell types included in the dataset. The "Additional marker gene list" file includes canonical cell type markers and malignant markers used in both anchor-based and marker-based cell type annotation analyses.